CDR Analysis in Telecommunications

Background
The telecommunication business is usually characterized by intensive competition between few incumbents and periodically new challengers in a saturated market where customers are cost sensitive, swapping providers is easy by regulation. So service hopping is common practice, a constant threat to even large established companies.
In this context providers constantly try to detect features and early indicators of potential user attrition. Traditionally this is challenging task by intuition and personal experience with unreliable result, exposed to seasonal changes and traffic usage fluctuations. Here we provide alternatives with stable, scientific data driven approach studying the social dimension manifested in the relationships among customers provided by social network analysis, a subfield of the graph theory.
As a demonstration, we focused on two essential problems of telecom companies: finding influencers and multi-SIM users among the customers.

Data Description
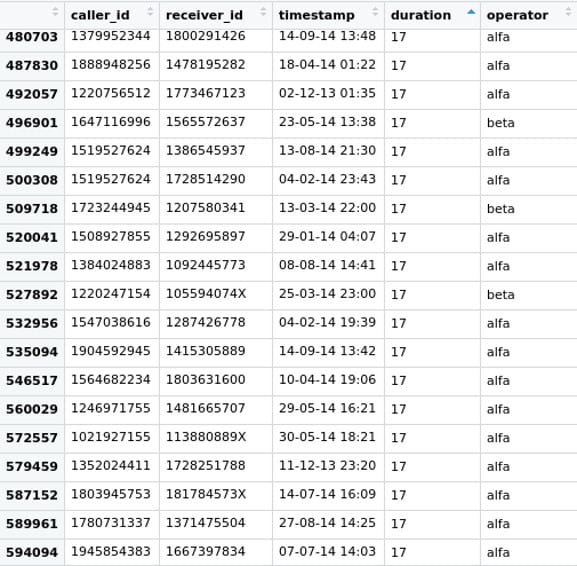
Call Detail Records (CDR) is a collection of data records produced by mobile telephone exchange (here considered as ``calls``).
We use an anonymized subset of CDR data with 1007091 calls of 1000 users over a year with information about caller and receiver IDs, operators, call start time and call duration.

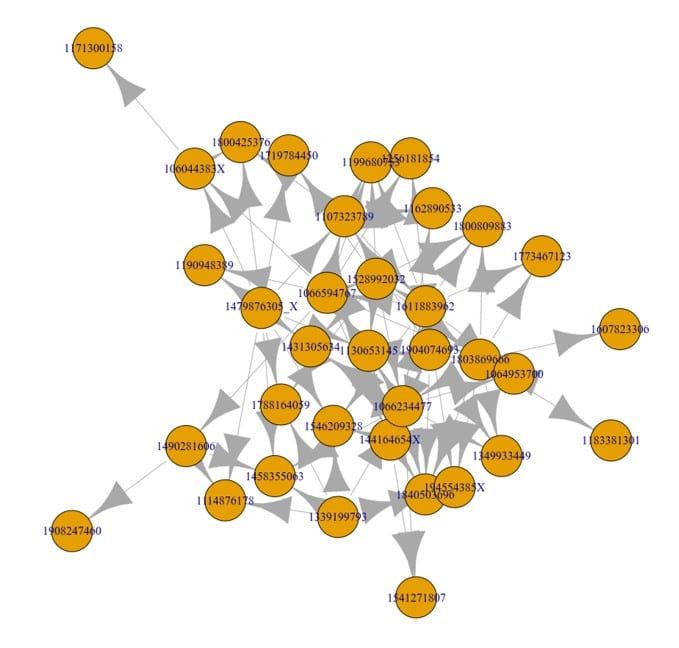
From the tabular CDR data available we have built a directed graph where nodes (vertices) represent users with their attributes (ID, operator), with edges representing calls between them also with attributes (time, duration). See small subgraph:

Finding Influencers
An influencer in a network is defined as a node (here: a user) who is well connected and hence is capable of propagating information to lots of other people. In telecom domain this feature ensures low churn risk and high potential for diffusion of (both positive and negative) information about products and services so identifying them has business value.
Here we apply eigenvector centrality to assign influence score to each nodes. This score is calculated iteratively on the neighbors’ centrality in turn (akin to PageRank).
The influencers identified this way could be directly targeted with special advertising and offers to involve them in disseminating information or prevent their attrition.

Multi-SIM Subscribers
A subscriber might possess more than one SIM card across different providers. Inter-operator Multi-SIM users have a higher potentiality to churn and they cost the operator to lose the chance of initiating and receiving all their traffic. Additionally, detecting the Multi-SIM subscribers across different operators allows for more usage profiling that will help create more tuned campaigns.
Our solution is a supervised method that creates similar node pairs by cloning 50 random nodes with transferring random proportion of existing edges from the original to the clone, such a way ensuring real-life grade activity similarity between the two nodes.
Solution and Evaluation
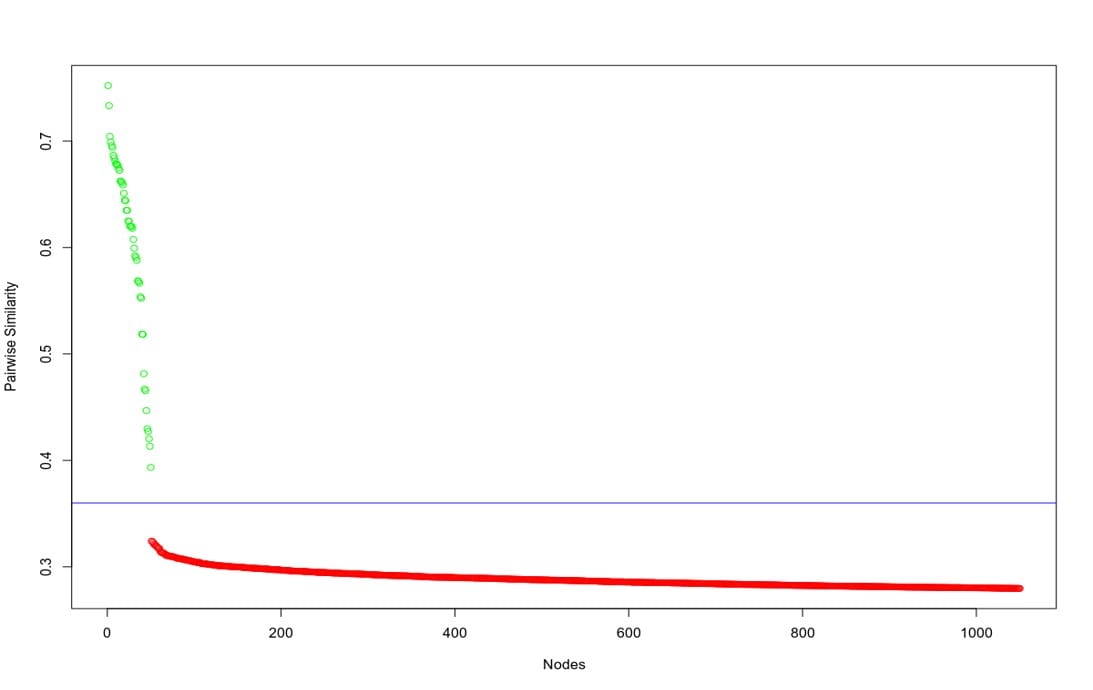
To detect probable duplicates we found the most similar twin to each nodes by computing pairwise Jaccard similarity on the adjacency matrix with the assumption that pairs with high similarity level are real clones and vice versa.
The visualization shows that the assumption is confirmed: nodes that have synthetic pair cloned from them (green dots) have close pair (high similarity) and vice versa (red dots: nodes without synthetic clone). Additionally, clear gap (around blue line) exists in the score continuity which could be interpreted as threshold for duplicate selection.

Insights from Call Frequencies
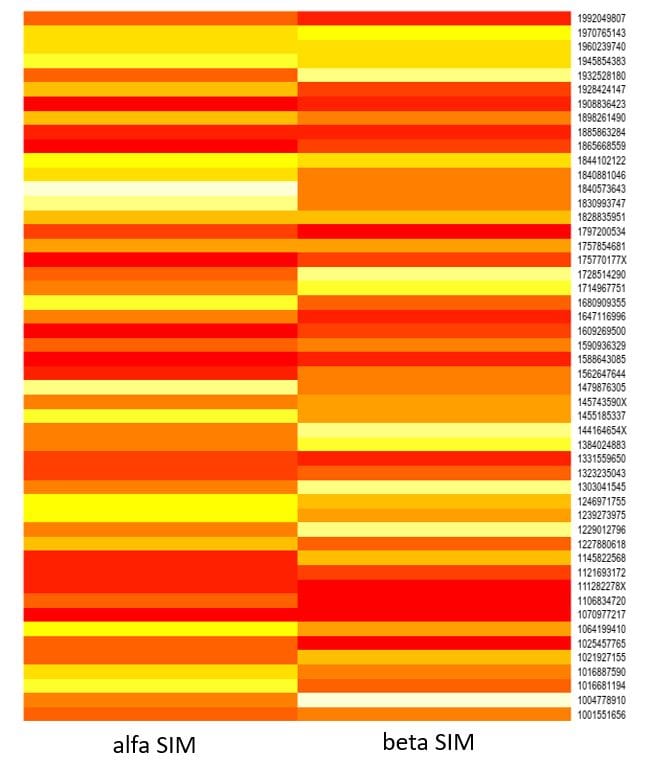
This heatmap shows the call frequency – number of calls on different providers’ network – in case of dual SIM-holders. The larger the differences between number of calls, the more attached the respective caller is to the more intensively used SIM card. This indicates clear attrition threat to the minority operator proportionally to the difference.
Further possible refinement of the approach is to study the tendency of usage change over time, being able to raise alert if a user starts to use our network less intensively than usual, and so giving a chance for the operator to interfere.

The greater the difference in the number of frequencies, the more the user is tied to the majority provider (higher drop-out risk and smaller provider) Change in proportionality at intervals.
Search
Tech Stack
Android
Angular
Apache
Artificial Intelligence
Business Analysis
C++
Centura
Cloud
Docker
EAPware
Firebase
Gitlab
Industry 4.0
IoT
Java
JavaScript
JIRA
Linux
Load Test
M2M
MariaDB
Microservice
NLTK
Node.js
OpenWRT
Oracle
PHP
PLC programming
Python
PyTorch
RASA
Scikit-learn
TensorFlow
Test Automation


